Share this report with anyone via, email, social media, etc.
Share on Facebook Share on Twitter Share on LinkedIn
Or
Email this Report

This information may be downloaded and printed in the provided format. However, the information may not be sold, license distributed, reproduced or otherwise used for commercial purposes, except with the express written permission of the Association. All data from the Multiple Listing Service® System. Data is refreshed regularly to capture changes in market activity so figures shown may be different than previously reported. Powered by Trenlii Inc.
This CMA report cannot be accessed at this time. Please contact the agent that sent you this report to get access.
Is it that time already?
What is included in this PDF
What is NOT included in this PDF
This Condo Market Report shows all of the TREB reported Sales from Jan-Mar 31 2020 for 1-15 Michael Power Place. You can check out exch listing at the end of the report and see from photos the upgrades or not.

The Gordons: Etobicoke Residents & Realtors We use our decades of experience living and working in Etobicoke to represent buyers and sellers. Real Estate can be a complicated process and is the largest investment you will make. With over 40 years of experience in sales, we provide our clients with the knowledge, resources and commitment it takes to get them moving. Let our family help yours buy or sell. #wegetyoumoving. Our website EtobicokeForSale.com will provide you with current listings, how to buy or sell and much more. Check it out today!
Kathy and Lauren Gordon
Sales Representatives
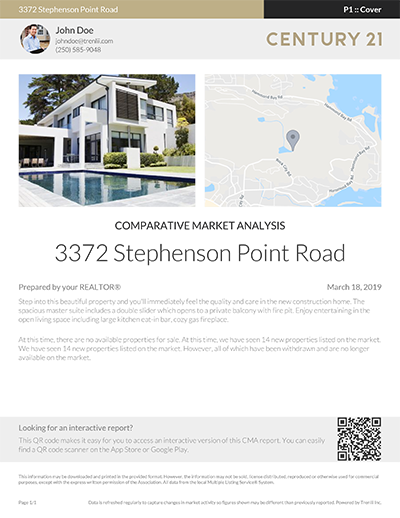
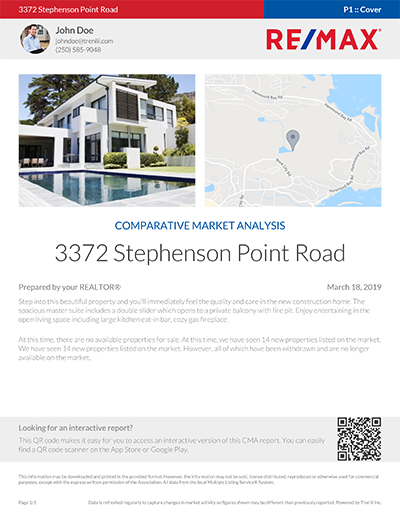
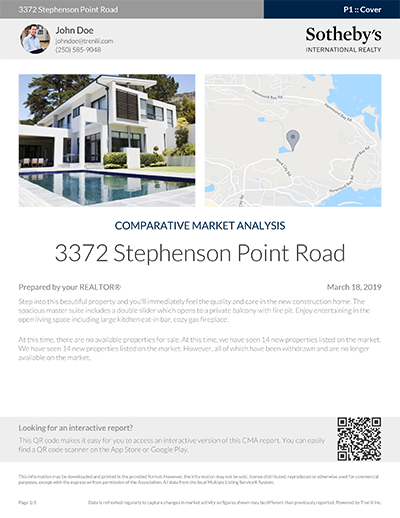
At this time, there are no available properties for sale.
90.91% of the 16 properties listed have sold, resulting in 14 sales. No other properties have been sold at this time. We have seen one of the 11 new properties listed become withdrawn and no available to buyers at this time.10 properties have sold for above their asking price, 3 properties have sold for below their asking price and one property has sold at it's asking price. When comparing the average sales price of $531,200 to the MLS® wide year-to-date average sales price of $522,657 we are seeing an increase in average sales price by 1.63%. At this time the average days on market is 10 and we have seen a median days on market of 9, an average asking to selling ratio of 1.0245 and a median asking to selling ratio of 1.0014. At this time, the total sales volume is $5,312,000. The median sales price has decreased by 27.69% when compared to the MLS® wide year-to-date median sales price of $719,109, resulting in a value of $520,000.
Below are the key metrics in your report.
Priority listings have been hand selected by your real estate professional. These properties match yours closely and can be viewed by swiping through the list below.
Walk Score helps you find a walkable place to live. Walk Score is a number between 0 and 100 that measures the walkability of any address.
Residents of walkable neighborhoods weigh 6-10 lbs less. Walkability may also have mental health benefits.
87% of CO2 emissions come from burning fossil fuels. Fewer cars on the road means less smog and less traffic.
Research shows that 1 point of Walk Score is worth $3,250 in home value. Additionally, cars are the second largest household expense.
Do you have to commute to work? Type an office address or destination in the input box below and calculate the time it will take to commute.
Below are a list of price ranges of properties within this report. This is useful to find which price bracket has the lowest days on market at the highest price ratio.
| Price Range | Avg. List Price | Avg. Sale Price | Avg. Inactive Price | Avg. Dom | Price Ratio | |
|---|---|---|---|---|---|---|
How much is the cost of living in your area? Calculate your mortgage, property tax, insurance and utility expenses using the form below.
Below is a list of all listings that your agent has included in the report. These listings are used to calculate the various metrics and statistics throughout the report.
This information may be downloaded and printed in the provided format. However, the information may not be sold, license distributed, reproduced or otherwise used for commercial purposes, except with the express written permission of the Association. All data from the Multiple Listing Service® System. Data is refreshed regularly to capture changes in market activity so figures shown may be different than previously reported. Powered by Trenlii.
The following areas are being used in this analytic.